I will plot scientific graphs, charts and visualize business data excel origin tableau
Expert Data Visualization Services
Get high-quality data visualization for scientific experiments, simulations, or research projects. I offer:
– Customized graphs and plots (2D and 3D) in:
– Line graphs
– Scatter plots
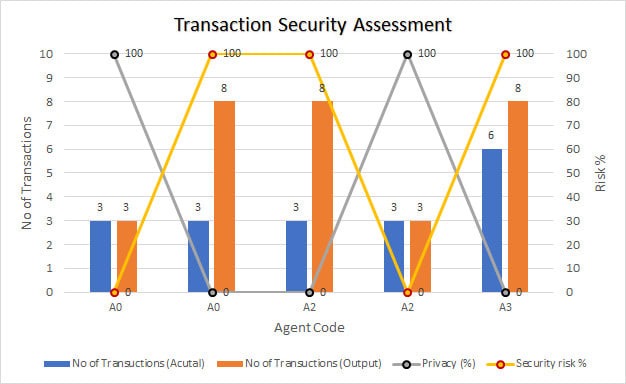
– Bar charts
– Pie charts
– Area plots
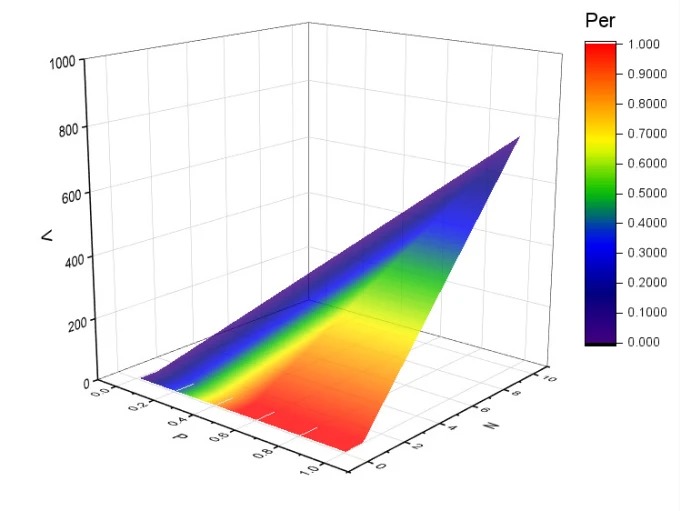
– Surface plots
– Data mapping
– Services include:
– Graphs with multiple Y-axis
– Overlapping/combining graphs
– Material science-related graphs
– Experimental data arrangement and plotting
– Calculation of specific parameters from your data
– Proficient in:
– OriginLab Pro
– Excel
– Google Sheets
– Additional data analysis services:
– XRD (X-ray Diffraction)
– Hall effect measurements
– UV-vis
– FTIR
– TGA/DTA/DSC
– Crystallographic profile
– Data extraction
Let’s create visually appealing and informative graphs for your research!
We write rarely, but only the best content.
